AI Referral Processing for Children's Residential Care
The Problem Space
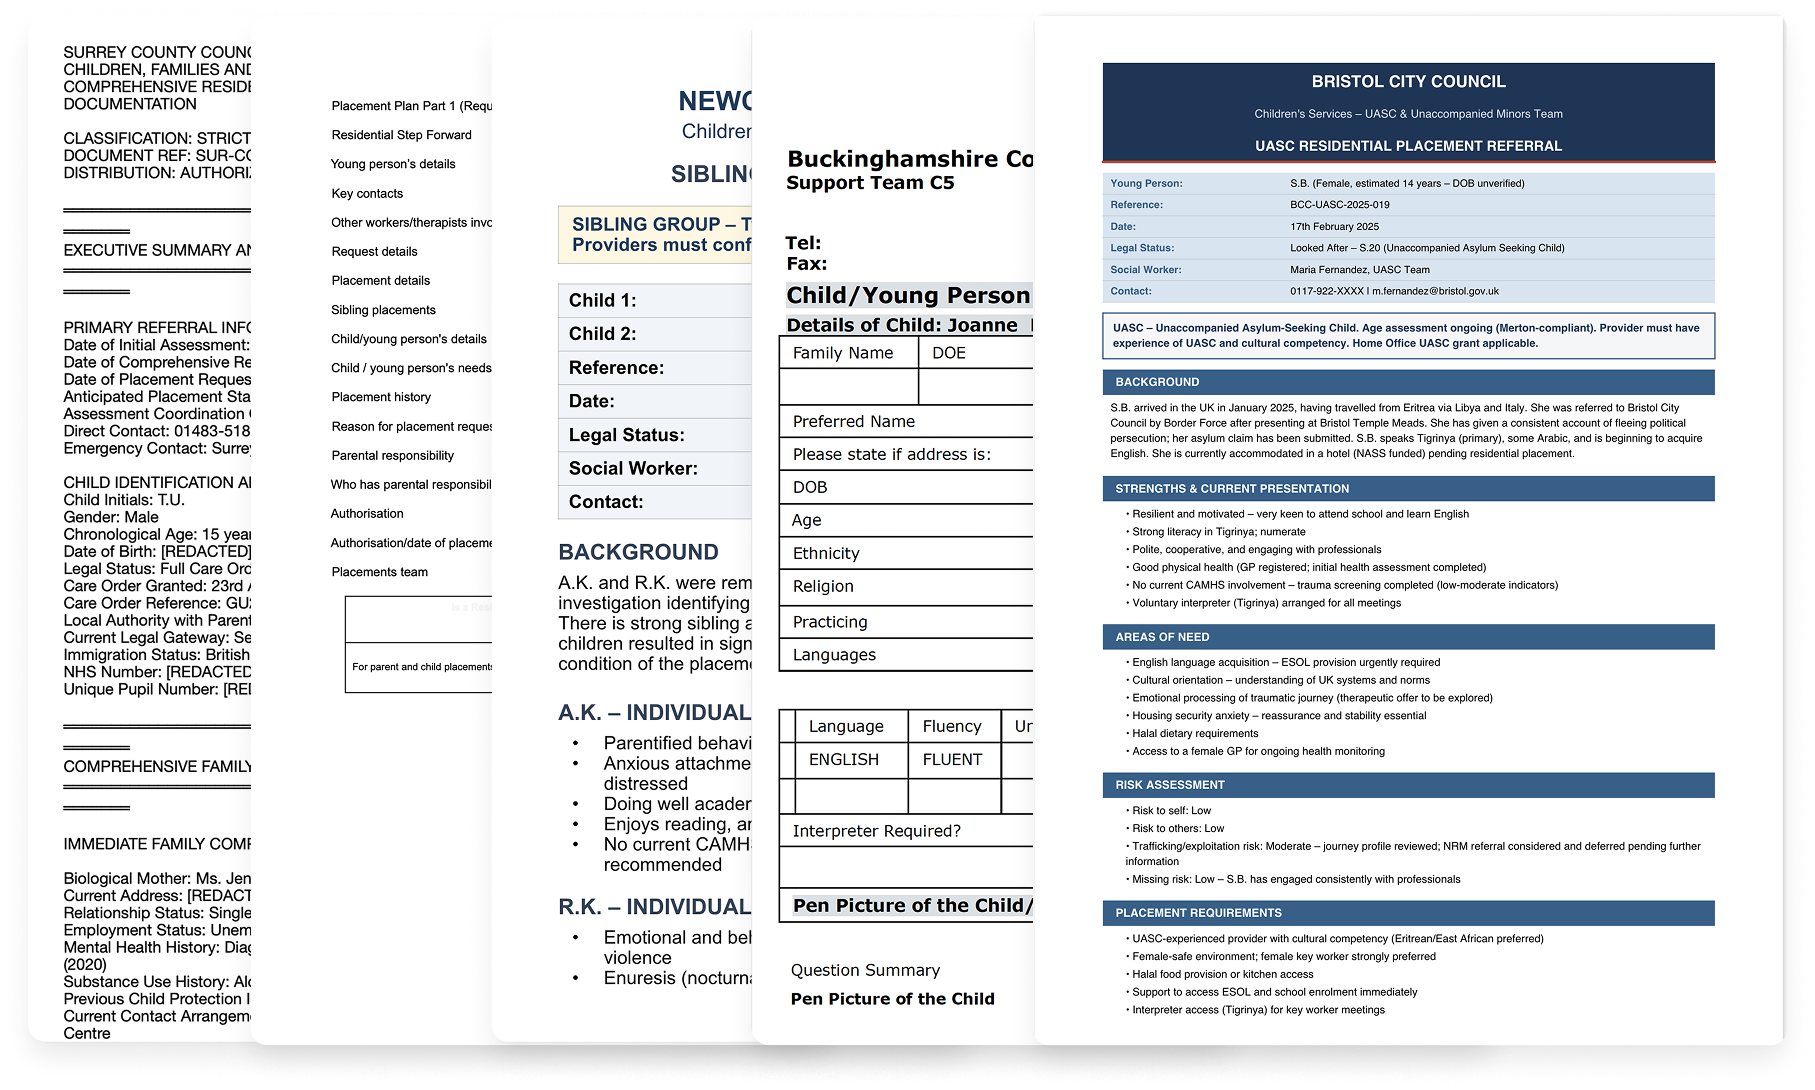
Children's residential care providers in the UK receive hundreds of referrals weekly, each representing a child who needs a safe placement. These arrive as lengthy documents in unstandardised formats from different local authorities, containing information that's often outdated, incomplete, or vague. Managers must assess complex risk factors, cross-reference against existing residents, and respond the same day. When placements break down, children get moved again, compounding trauma.
We designed Bridge, an AI platform that extracts key decision factors from any format into a standardised view, centralises scattered sources, reducing assessment time from 5-20 minutes to seconds.
My Role
I joined Elyndra as the founding designer. I owned the product function end-to-end, translating daily between user needs, engineering constraints, and business goals.
That meant decisions beyond interface design: what to build first and what to defer, when the value proposition needed to shift, how to navigate competing stakeholder demands. Without a dedicated product manager, I created alignment artefacts (roadmaps, release sheets, planning trees, etc) to keep the team oriented as priorities changed.
-
Planned and conducted 30+ semi-structured interviews across different care organisations, including referral officers, registered managers, directors and clinical psychologists. Build personas, mapped the referral ecosystem and identified structural dynamics and user needs that shaped prioritisation and product direction.
-
Designed Bridge end-to-end, from information architecture to production-ready specifications. Iterated continuously using Figma Make, building clickable prototypes. Used Tailwind UI as the foundation for visual consistency, making a choice not to invest in a formal design system while the product direction was still shifting. Also designed the marketing website.
-
Created and maintained roadmaps, release sheets, sprint planning documents, and feature planning trees to keep the team aligned as priorities shifted. Wrote detailed Jira tickets that included problem context and user benefits alongside technical specifications. Produced research synthesis documents, interview summaries, and insight decks that made user evidence accessible to the team.
-
Co-facilitated sales demos and onboarding sessions with prospective organisations, adapting the product narrative in real time based on who was in the room.
The Team
Founding Designer: Andreea Nesu (Myself)
Founder & CEO: Marcus Wiliamson
Founding Engineer: Juanjo Diaz
Outsourcing Team of Engineers: Newtuple.com
Initial Discovery & Research
Prior to me joining, the team had been building Echo, a documentation tool already piloting in a few homes. But through early conversations with care providers, the referral problem kept surfacing. Unlike documentation, where solutions already existed, nobody was tackling referrals with dedicated technology. The need felt more urgent. We didn't abandon Echo, but we chose to focus on referrals.
Before touching any design tool, I needed to understand a domain I had no experience in. My first question wasn't "what should we build?" It was "what actually happens when a referral arrives, and who's involved?"
Secondary research: mapping the ecosystem
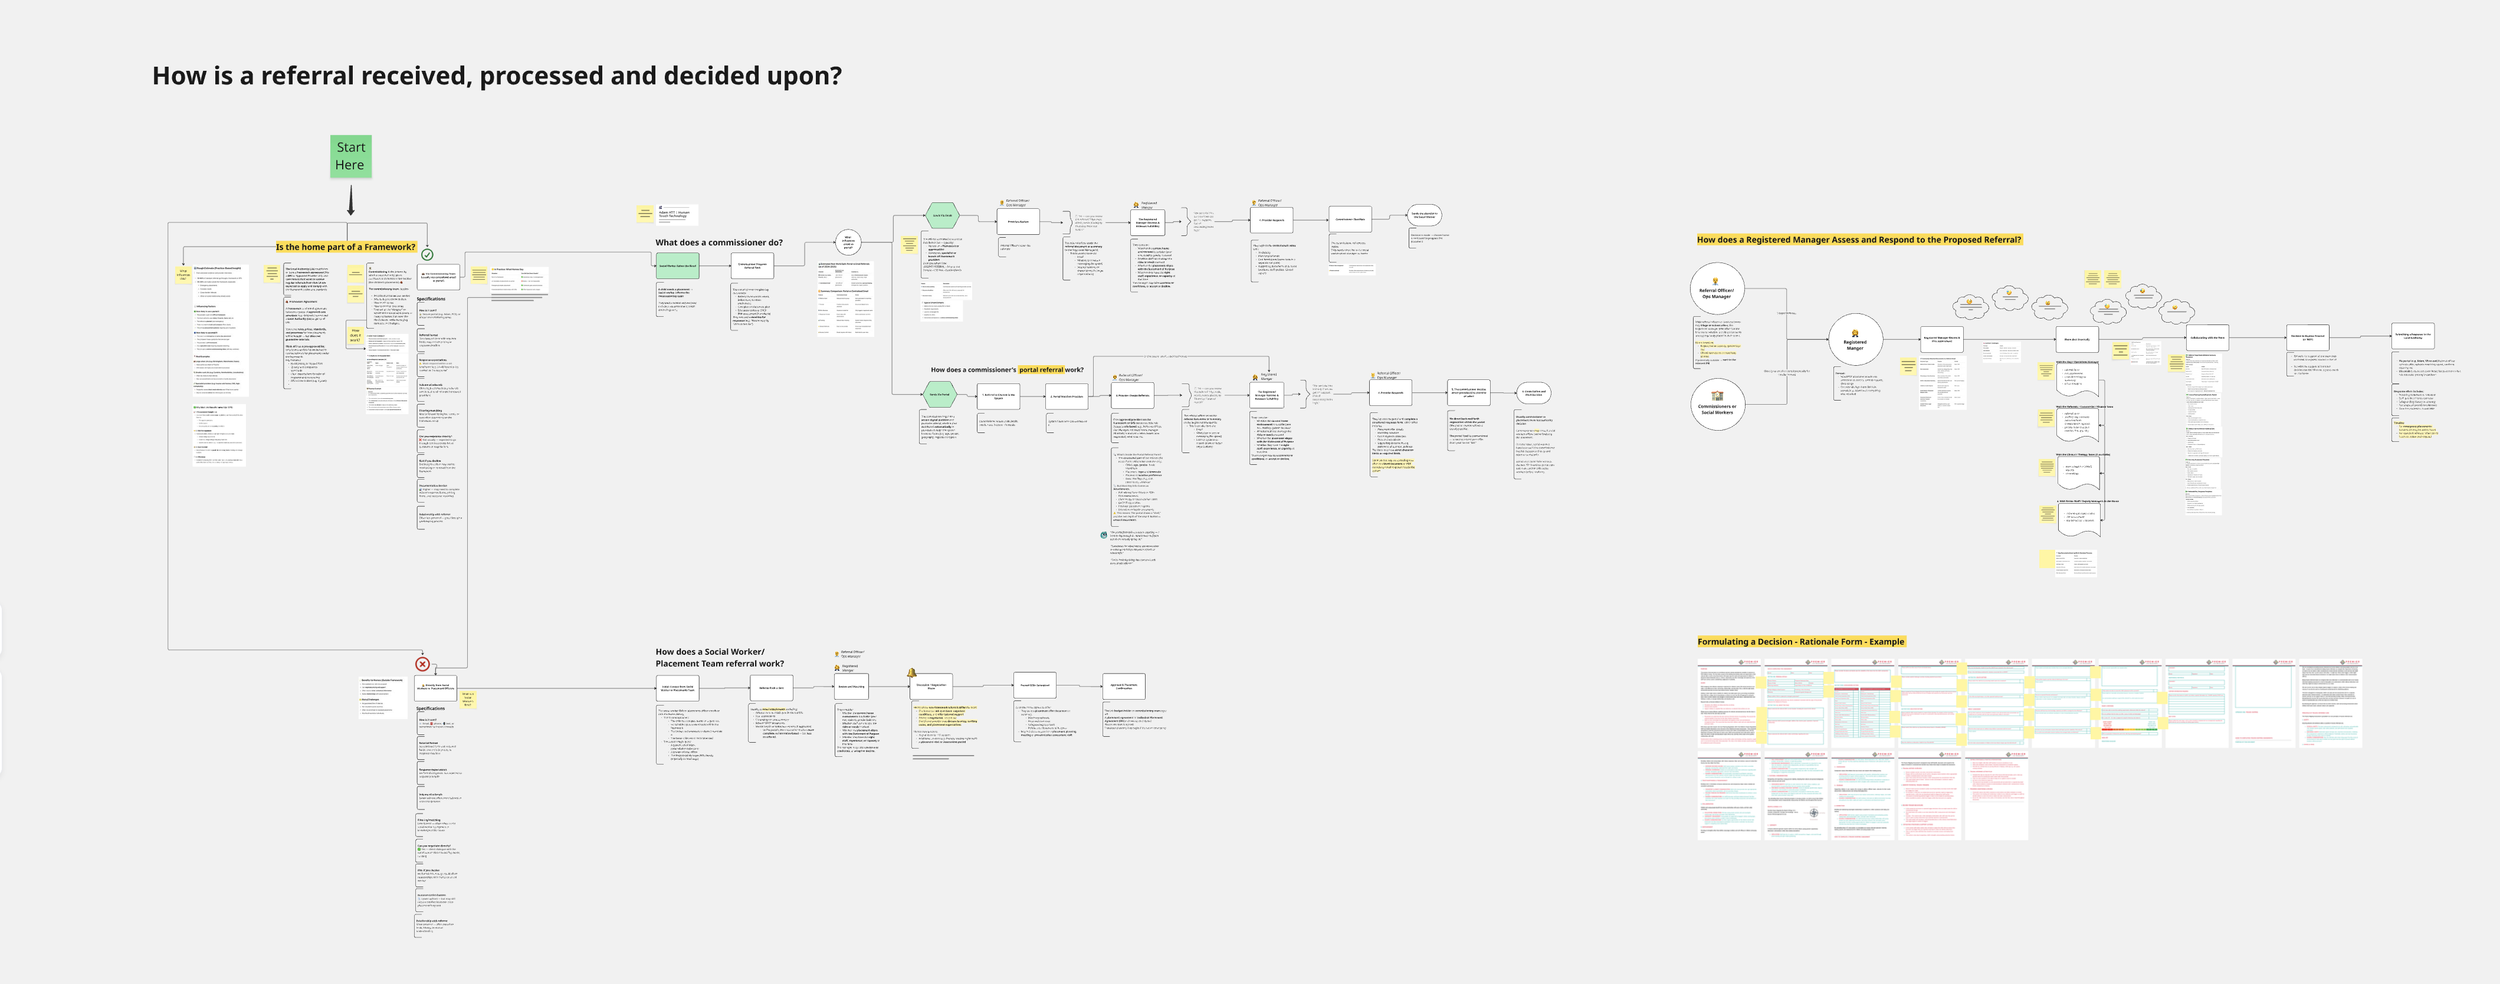
I started by mapping the referral process: which agencies are involved, who does what, and how they relate to each other.
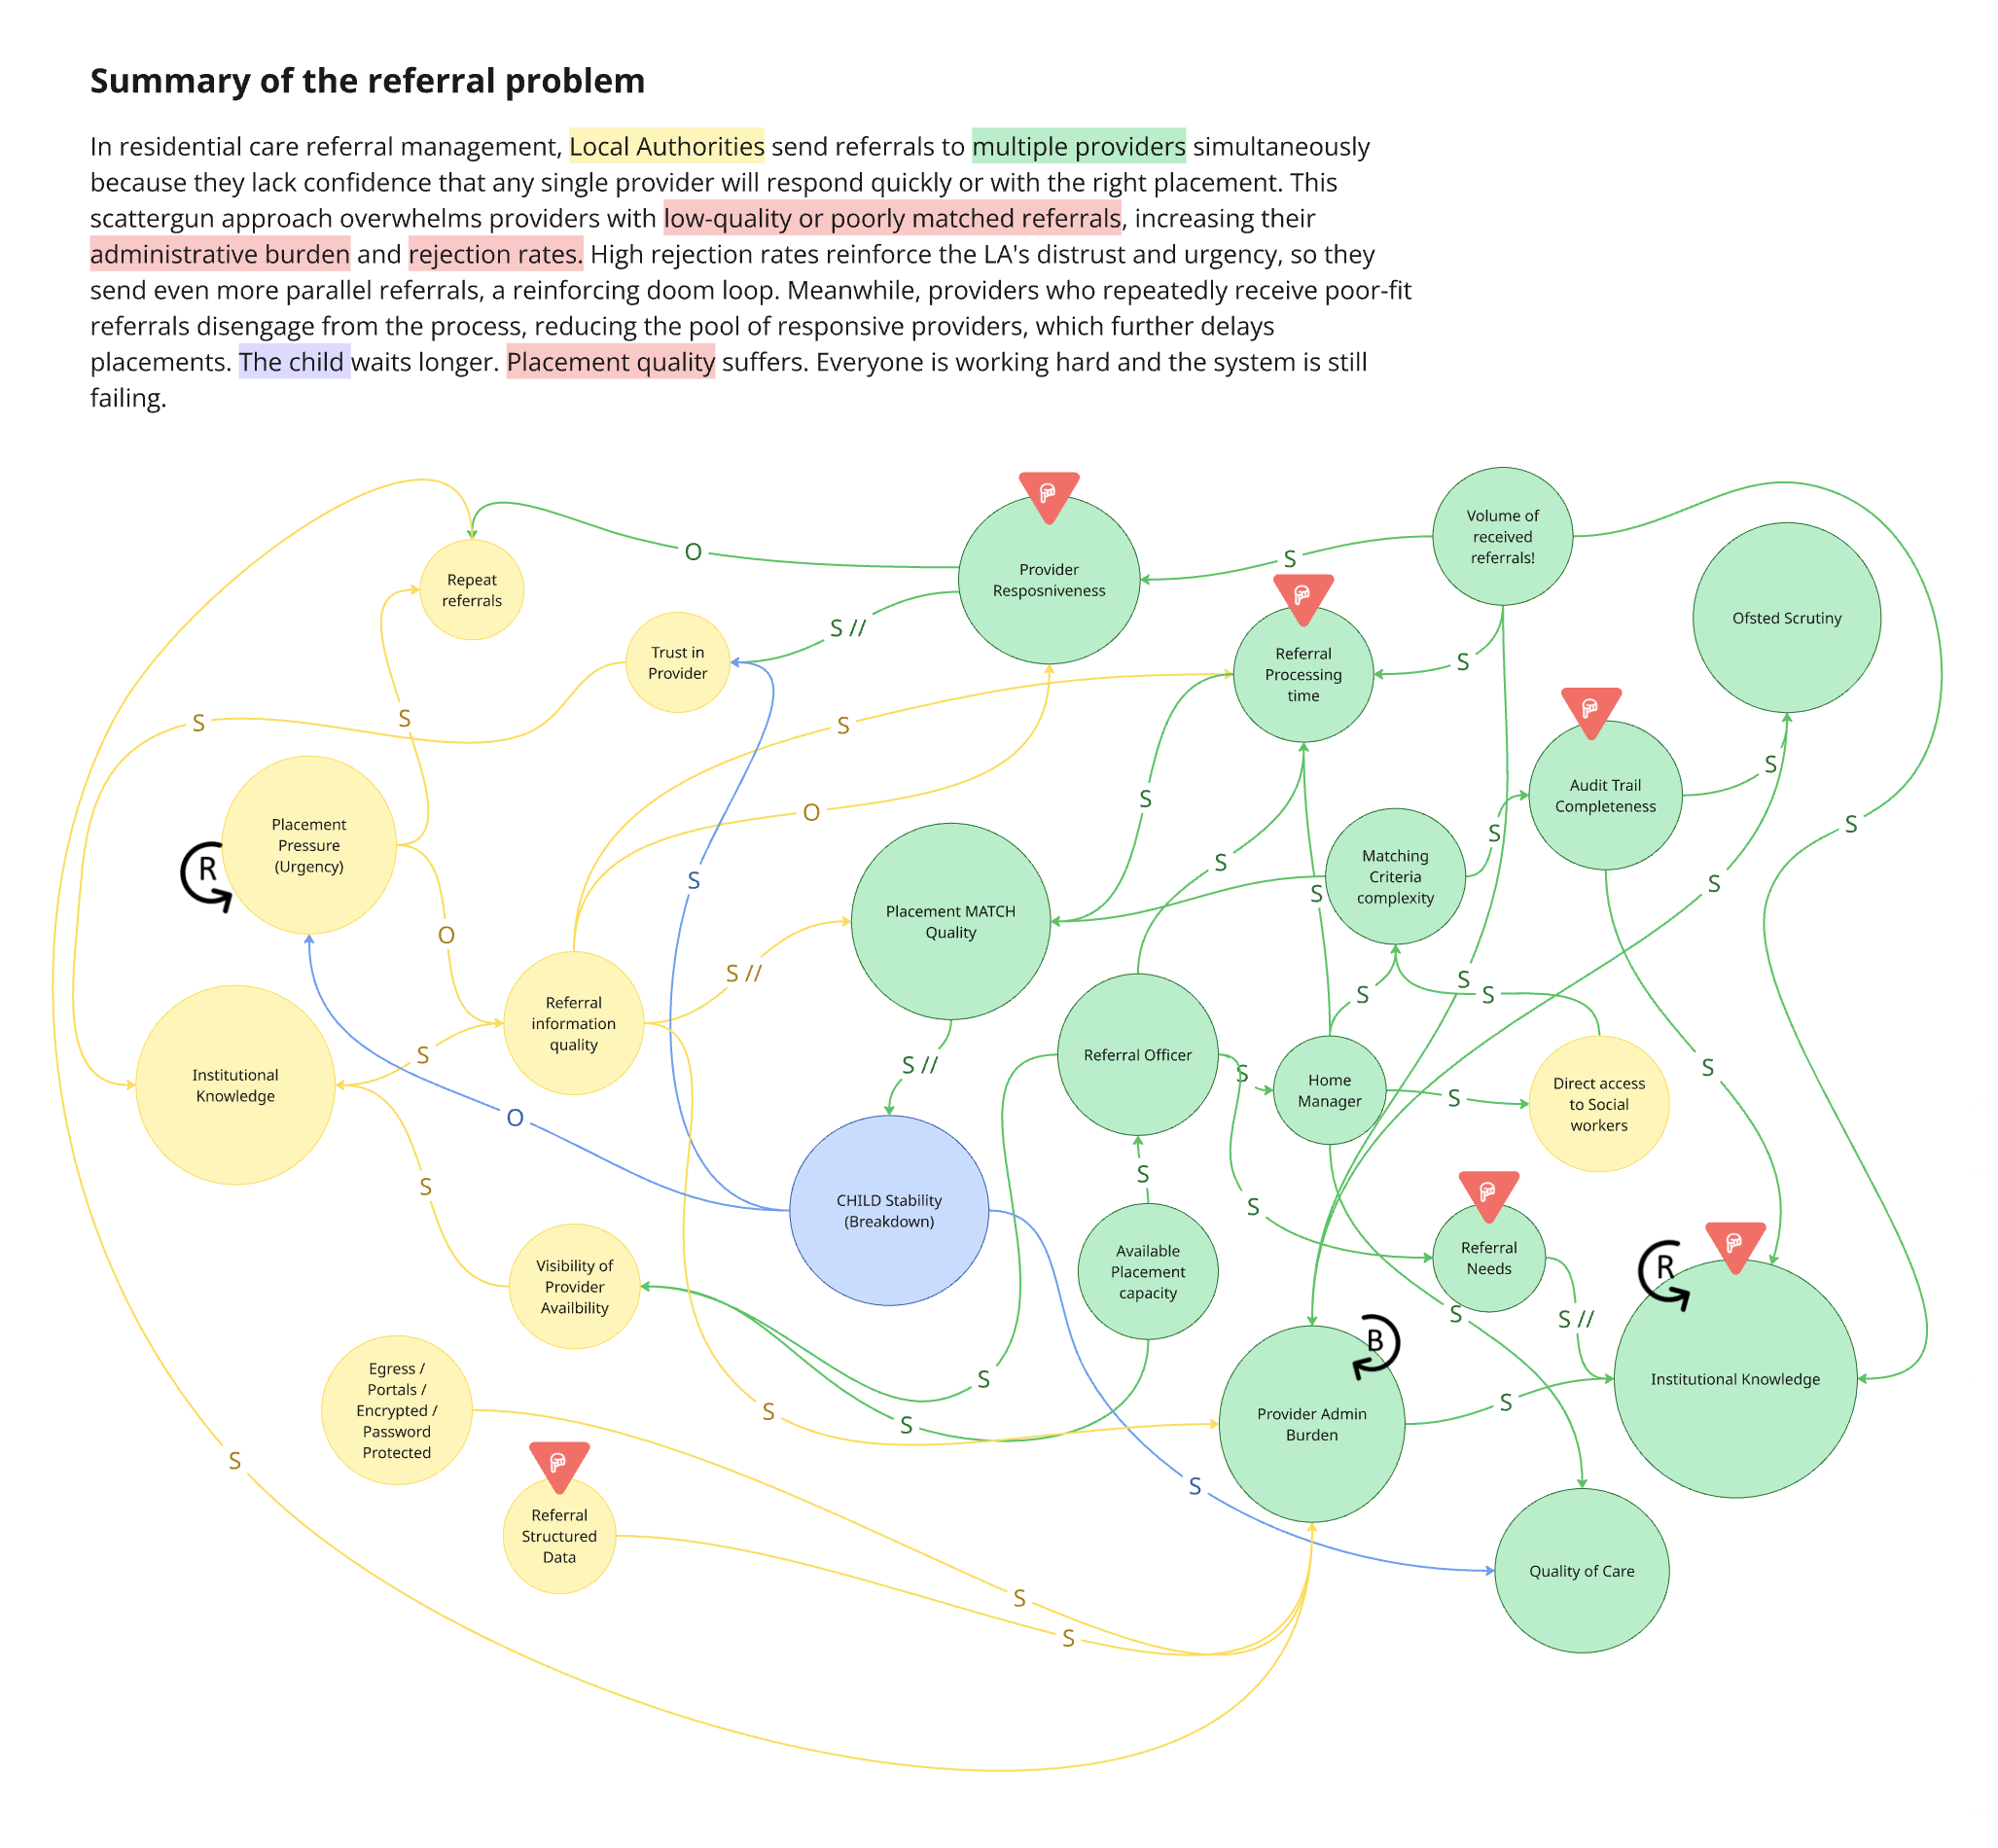
Local authorities hold the duty to find placements. Their social workers compile referral documents. Placement teams distribute these to providers, usually mass-emailing the same referral to dozens of homes at once ("spray and pray"). Care providers (from single homes to 200+ home groups) assess each referral against capacity, training, regulation, and the needs of children already living there. Ofsted oversees everything, scrutinising matching decisions and holding managers accountable.
The relationships are strained. Local authorities are under pressure to find placements quickly. Providers feel overwhelmed and frustrated by scattered information. Communication is difficult. Managers submit expressions of interest and most times hear nothing back.
Once I had a picture of who was involved, I mapped the dynamics between providers and local authorities: what happens when things go wrong, where pressure builds, and why the system stays stuck.
Three things stood out.
The system is caught in a pressure loop. When urgency increases, local authorities rush referrals out with poor information. Poor information leads to poor matching. Poor matching leads to breakdowns. Breakdowns create more urgency. There's no point where it self-corrects. This told us any intervention needed to target speed and information clarity first, because those are the points where the loop could be interrupted.
Providers absorb the burden to keep everything functioning. The admin overhead (reading, logging, tracking, responding, re-reading the same referrals) isn't a side effect. It's how the system compensates for poor upstream processes. Providers have to work very hard to sustain the system.
There is no shared data visibility across the system. Local authorities and providers operate with almost no insight into each other's patterns or decisions over time. Providers can't see what the needs are across local authorities, while local authorities can't see why providers decline. Neither side has the data to recognise trends, learn from outcomes, or improve their decision-making over time. The institutional knowledge that does exist is held by experienced individuals, built through years of pattern recognition, and lost when they leave.
User Interviews
Over June and July 2025, I ran 8 semi-structured interviews across 3 care providers with people covering roles from referral managers, home managers, directors and clinical psychologists.
Together, they painted a picture of a system under enormous strain:
The information problem is structural. Over 150 local authorities each use a different format. Documents are routinely outdated and sometimes deliberately incomplete. There is no national standard.
Admin crowds out the real work. Managers aren't slow because they lack skill. They're buried in admin that leaves no room for assessing compatibility, building relationships, doing qualitative work.
Nobody wanted full automation. This came up in every conversation, unprompted. The direction shifted from "AI matches children to homes" to "AI clears the admin so humans can match better."
"It's the worst thing about referrals, and that is that there isn't anything centralised. So you've got however many placing authorities, 40, 50 placing authorities, and every single one of them uses a different form." - Registered Manager
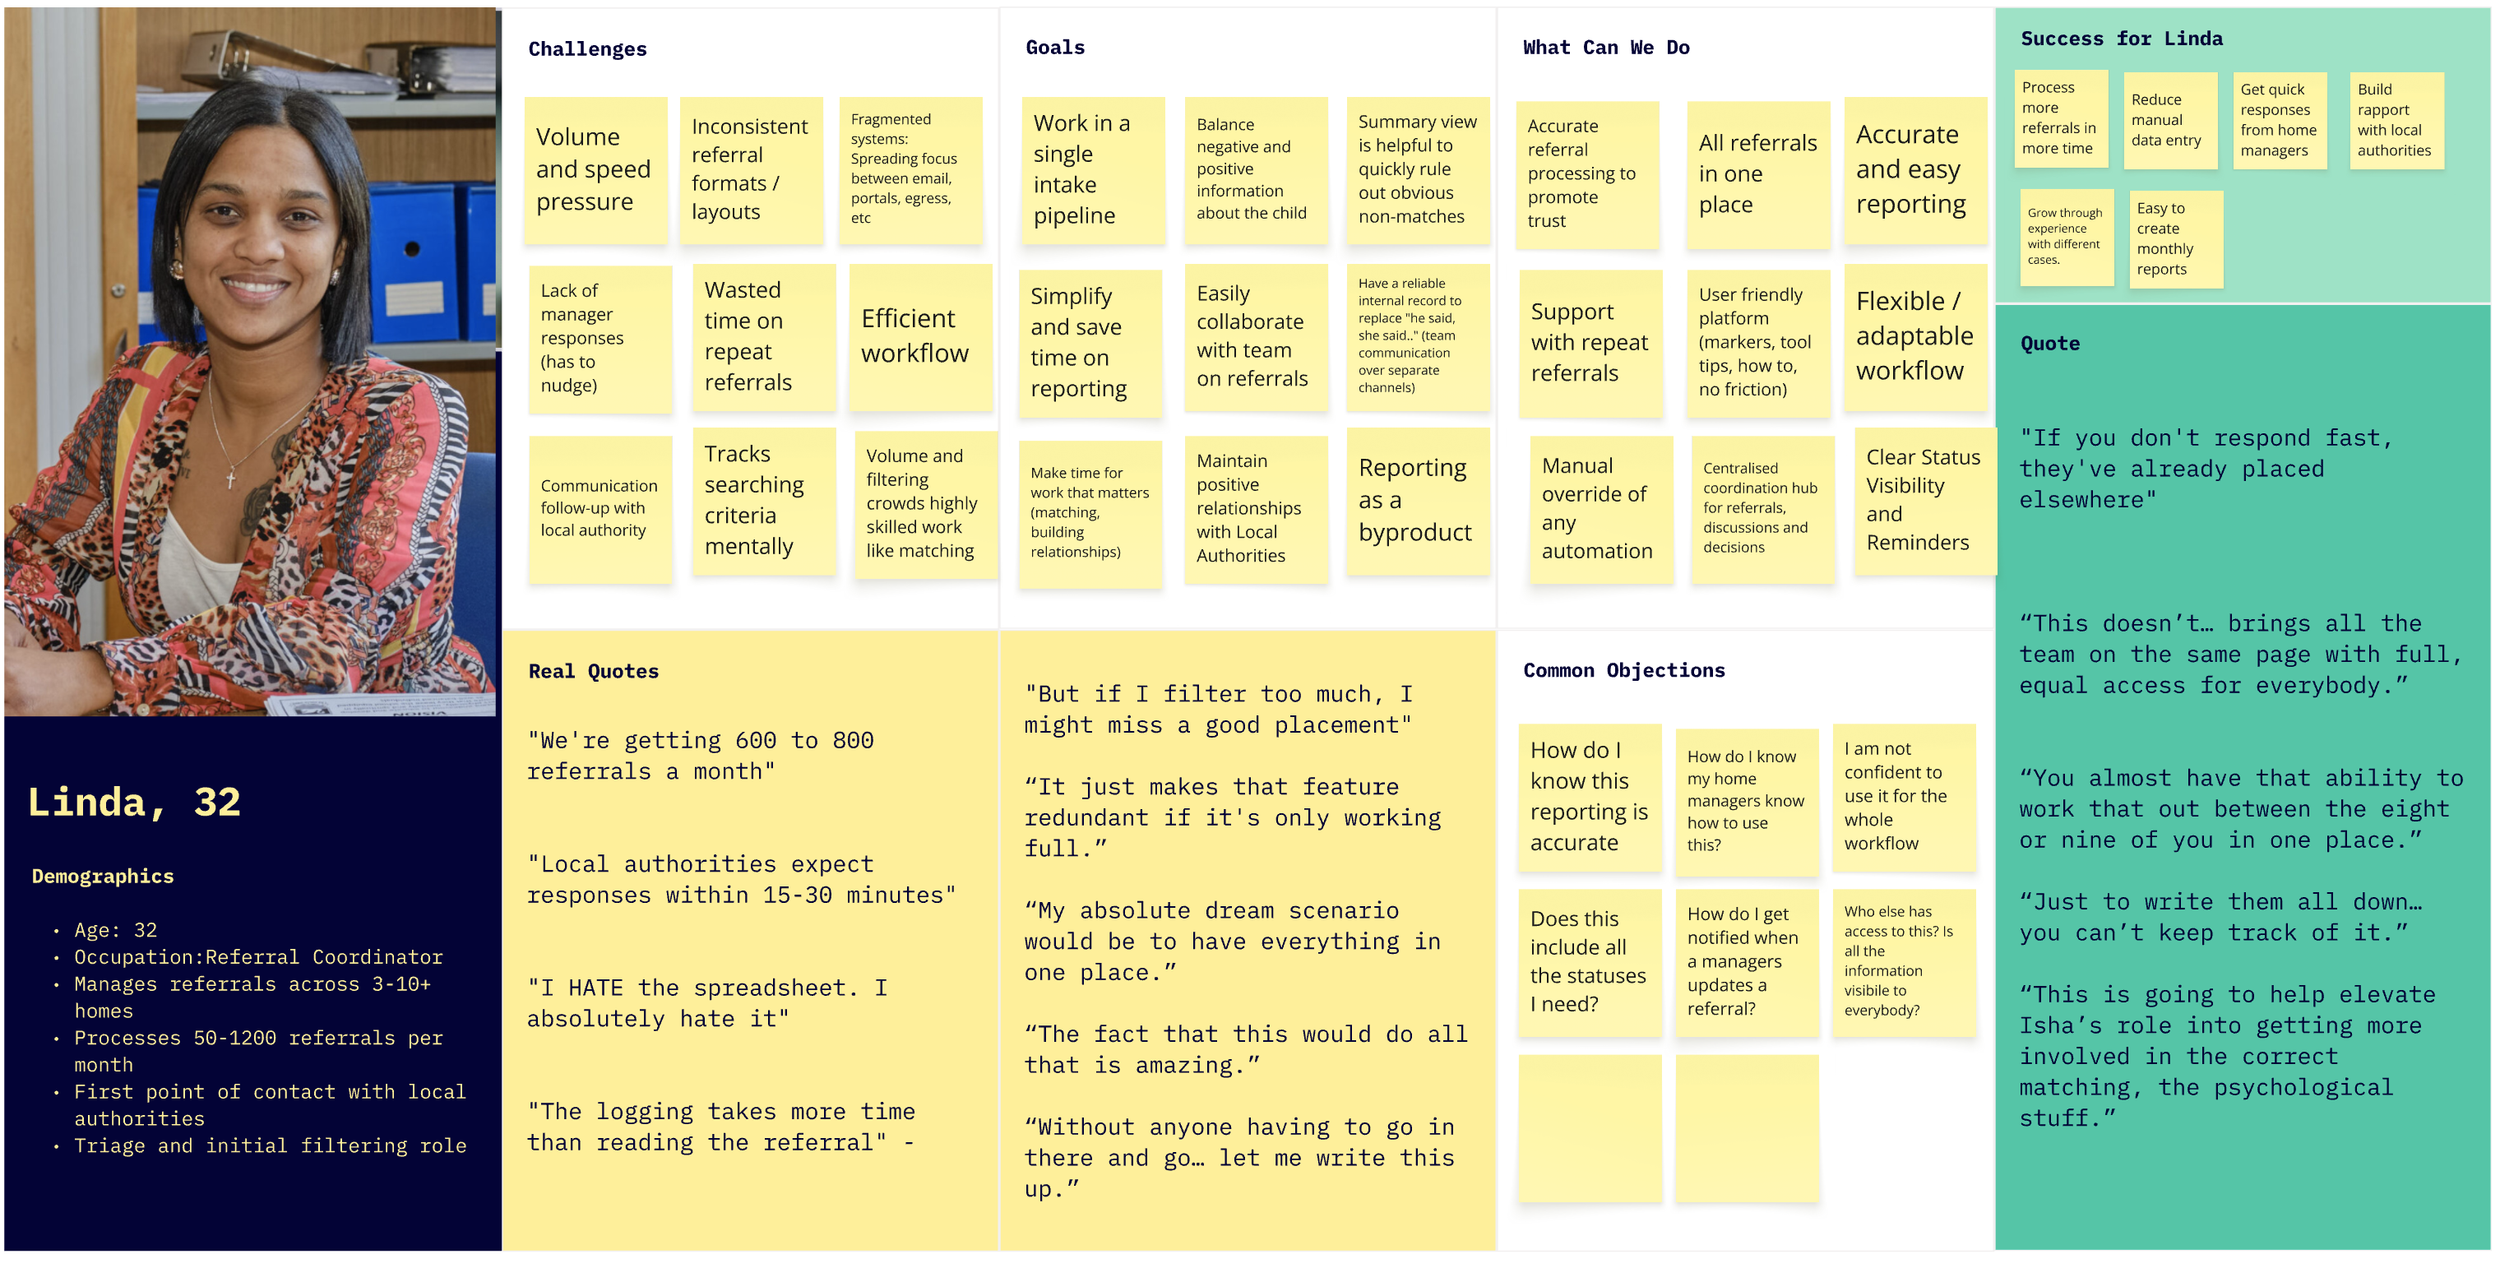
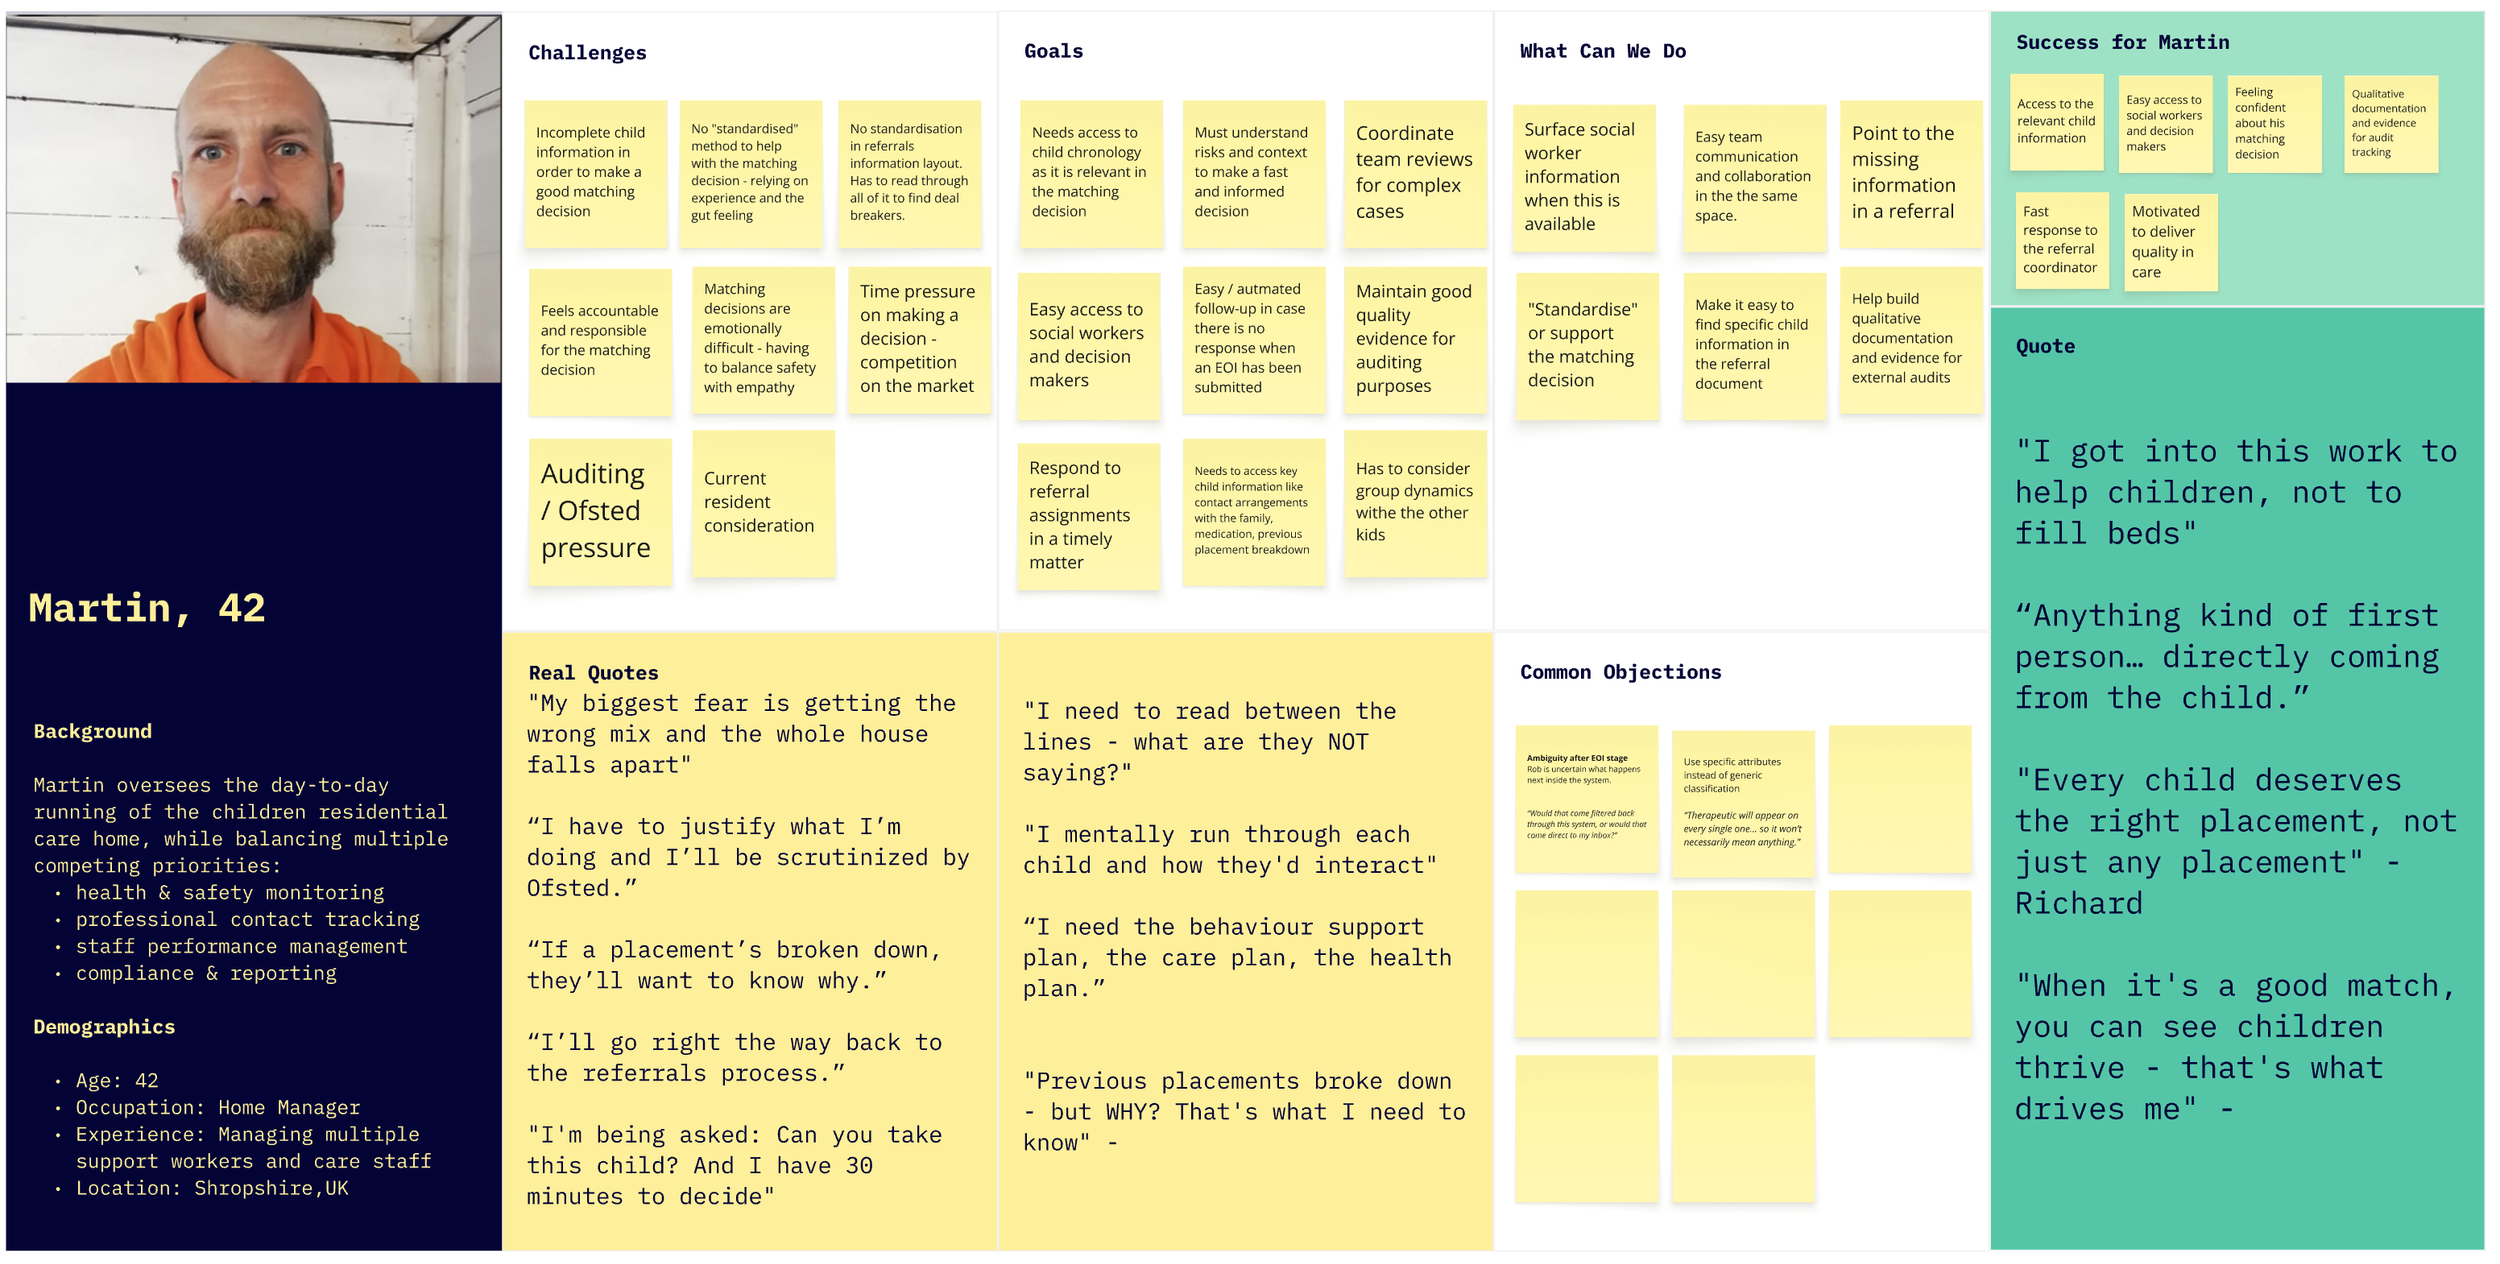
Two Personas, One Structural Insight
The most involved roles in the referral process were those of the referral managers and of the home managers.
Both personas described the same frustrations: volume and the need for standardisation stood above everything else, raised in every single interview. That made it our starting point and established Linda as our primary persona.
Volume overwhelms everything. Most of the day goes to reading referrals that will never be suitable.
Every referral is a puzzle. The same information, in different places across every document, makes it time consuming to read through.
Workflow is scattered across platforms. Outlook, Egress, placement portals, Excel, notebooks. Time lost switching, referrals missed between channels.
Repeat referrals eat up time. Same referrals are sent 2 to 4 times a week, sometimes with different subject lines, so they appear as new referrals.
The response cycle is broken both ways. Officers can't get managers to respond in time. Managers send interest and hear nothing back.
Manual logging is universally required and universally hated. Every organisation needs to track referrals. Everyone described it as painful, but leadership requires it.
Information quality is unreliable, sometimes deliberately. Experienced managers develop a skill for reading between the lines that newer ones don't have yet.
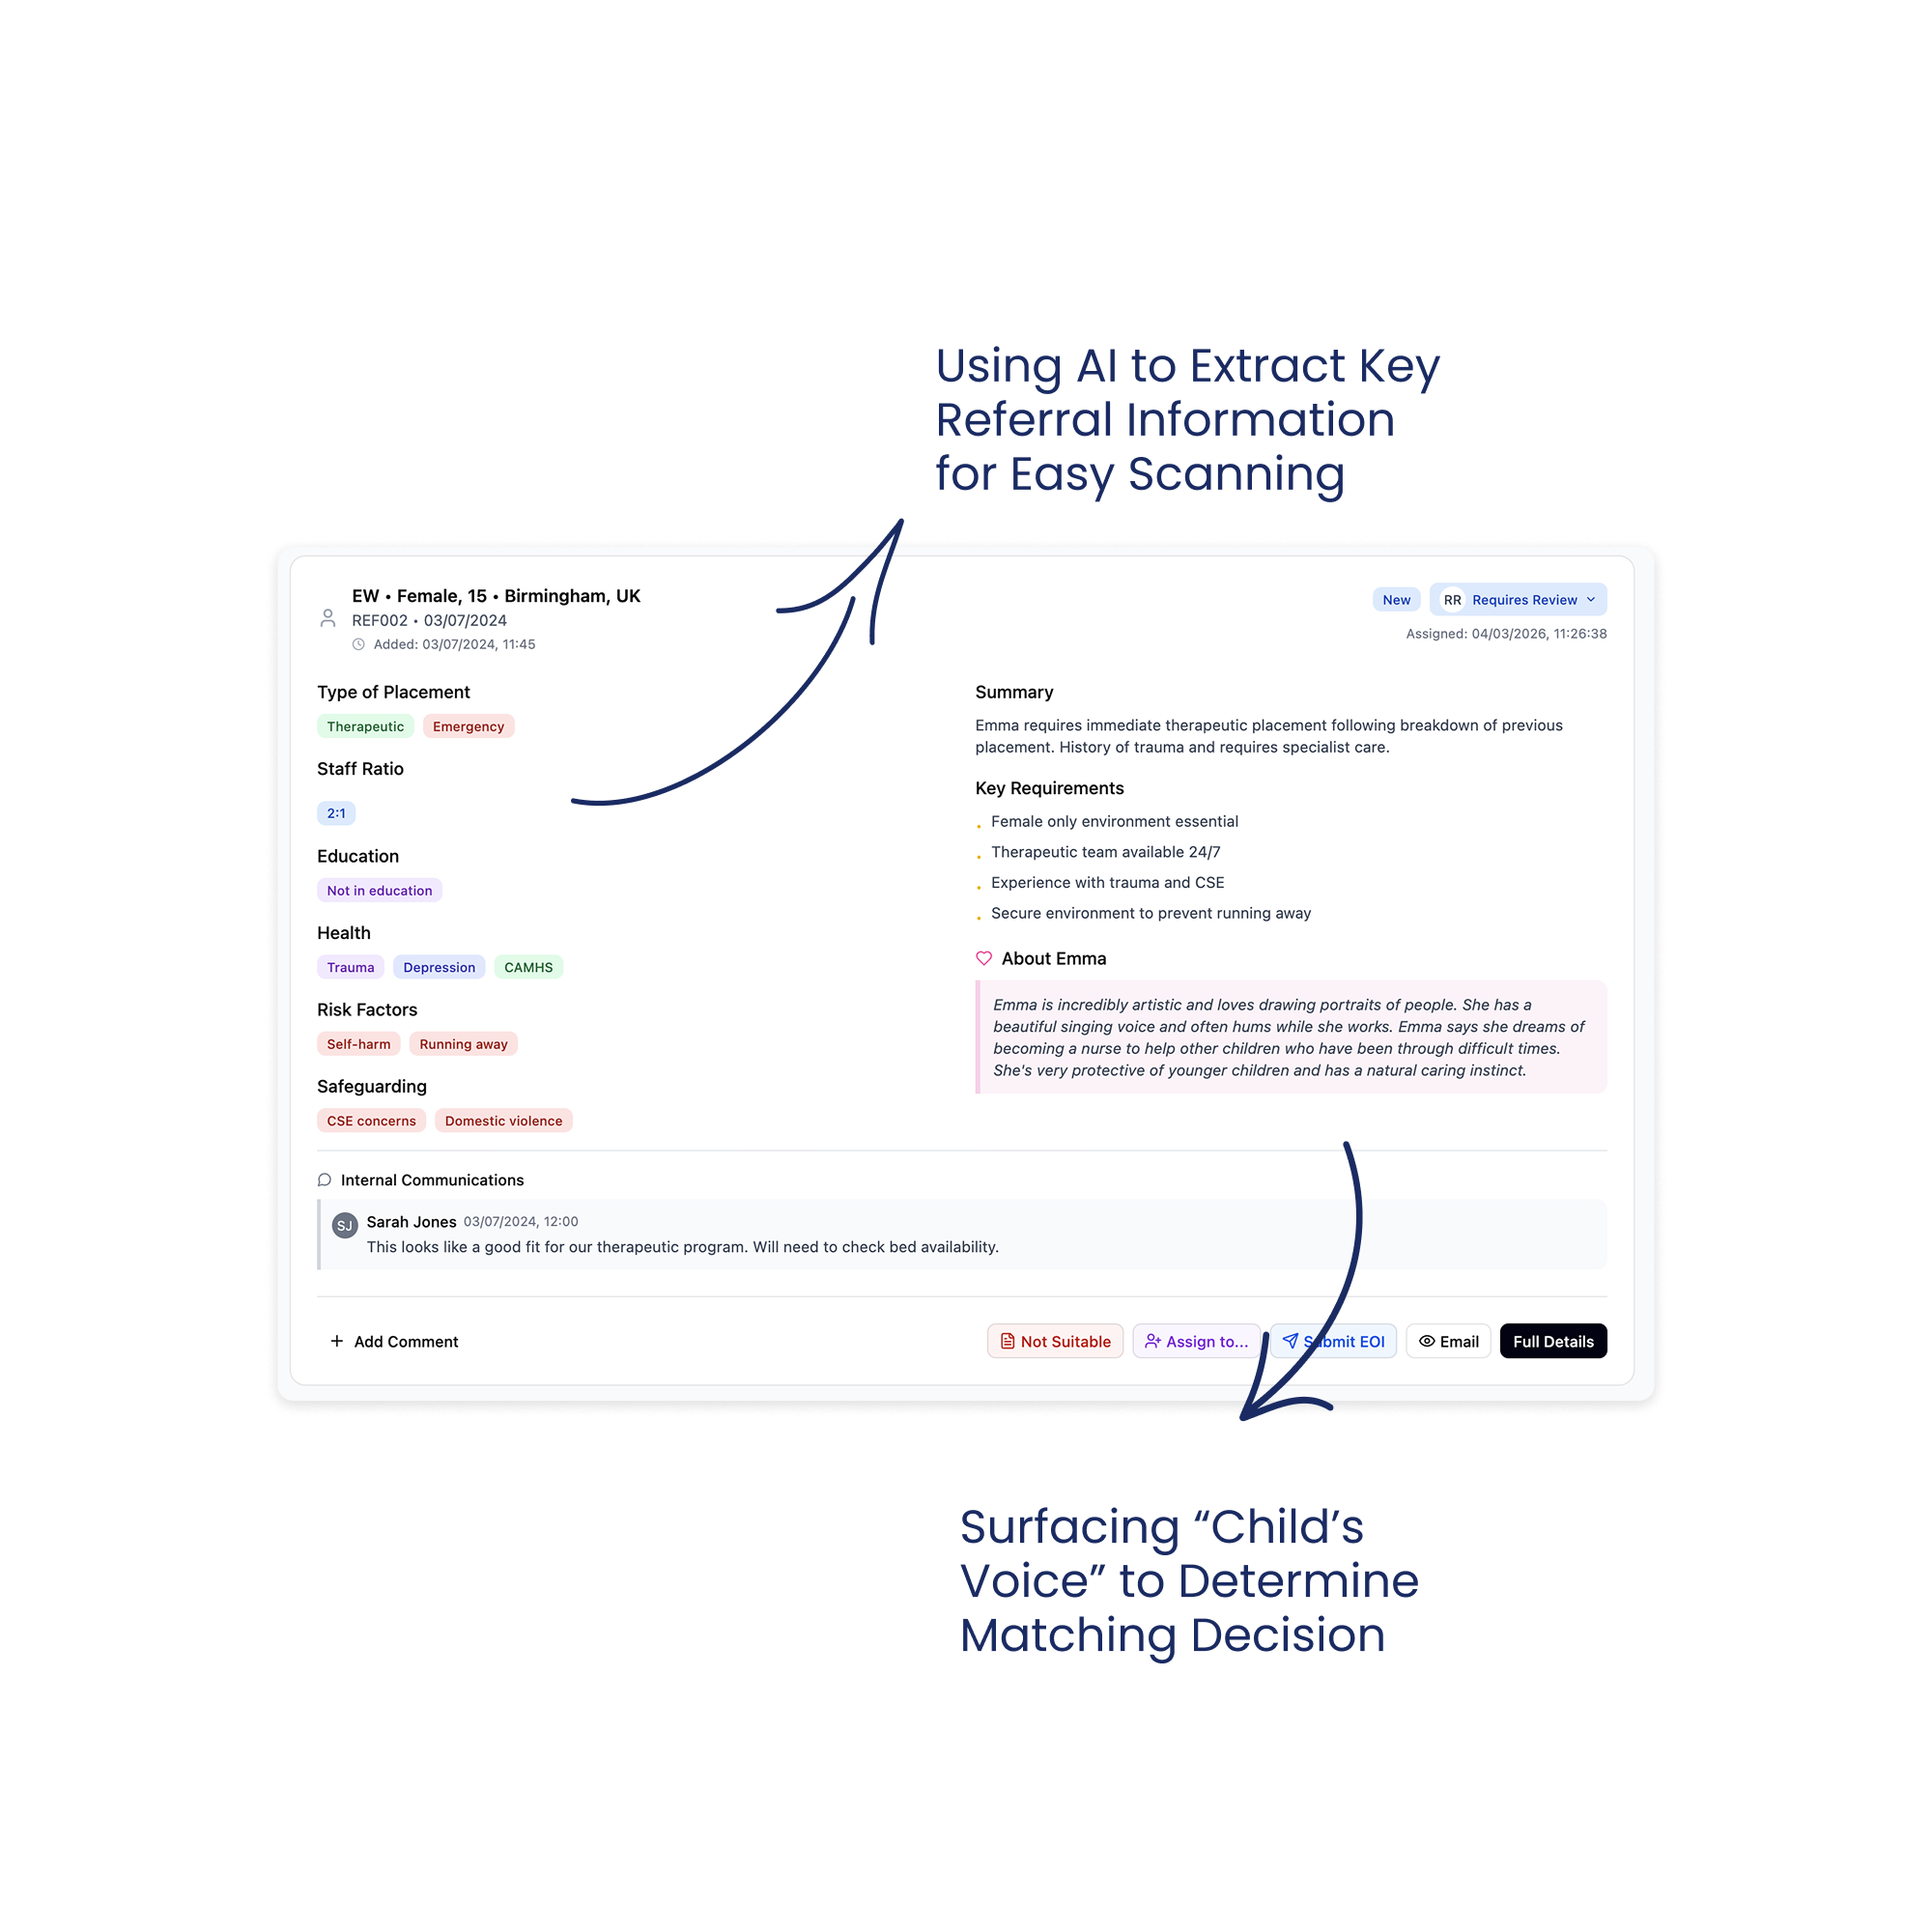
The "positive information" gap. Referral documents focus almost entirely on risk. Both personas wanted to see strengths, hobbies, interests. One manager described looking for "the voice of the child" and "glimmers of things they might be genuinely interested in."
"Don't get me started on the Egress or the Microsoft security access or the number of ways that they want to send it and the formats that are all different." Referral Officer
The structural insight: not every organisation has a referral officer. Some have a dedicated coordinator, others don't. The interface had to support both a coordinator-led workflow and a self-serve workflow from day one.
The Competitive Landscape
Almost nothing purpose built existed for children's residential care referrals. There have been attempts to solve this by local authorities grouping to create portals, but this is still on a local level, and it ended up in maximixing effort for providers having to access several portals. “Found by Lottie” provided great inspiration, but it serves adult care (different context). “Leaf” and some broader CRMs have basic features buried in larger systems. We even came across one organisations that started building their own internal solution but eventually stopped due to other priorities.
What we planned to build: V1
These shared needs pointed toward a clear build sequence - three layers of value, each one needing to prove itself before we invested in the next:
1. Foundation: Centralise and extract. Addresses: volume, unstandardised formats, scattered platforms
Pull referrals from shared Outlook inboxes via Microsoft Graph API into a single view.
Use AI to extract key decision factors (age, gender, risk factors, staff ratio, education needs, etc) from any local authority format into a standardised display.
Identify Edge Cases and provide a manual resolution at this stage; nothing automated yet.
Enable basic filtering to eliminate obvious non-matches.
This addressed the Referral Officer’s volume problem and the Home Manager’s reading time problem simultaneously, and by standardising all formats into one consistent layout, it removed the puzzle of locating information across different layouts.
2. Collaboration: Coordinate and communicate. Addresses: coordinator/self-serve flexibility, response bottlenecks
Assignment so that the Referral Officer can route referrals to the right Home Manager, but optional, so that Home Managers can can self-serve in organisations without a coordinator.
Team visibility into who's working on what, who's responded, and what's stuck.
Centralised communication so referral discussions happen in one place rather than across scattered email threads.
This layer had to work for both the coordinator-led and self-serve model.
3. Workflow: Respond and track. Addresses: broken response cycle, manual logging
Easy response to the Local Authority (sender), so the user doesn’t have to navigate to Outlook to respond.
Templated responses (decline with reason, express interest with information request) so both personas can respond in one click instead of composing individual emails.
Referral status tracking so the team can see where every referral sits — what's new, what's been reviewed, what's been actioned.
We planned to test this with two pilot organisations: one provider that has a referral coordinator to triage referrals and a second provider where managers self-serve.
-
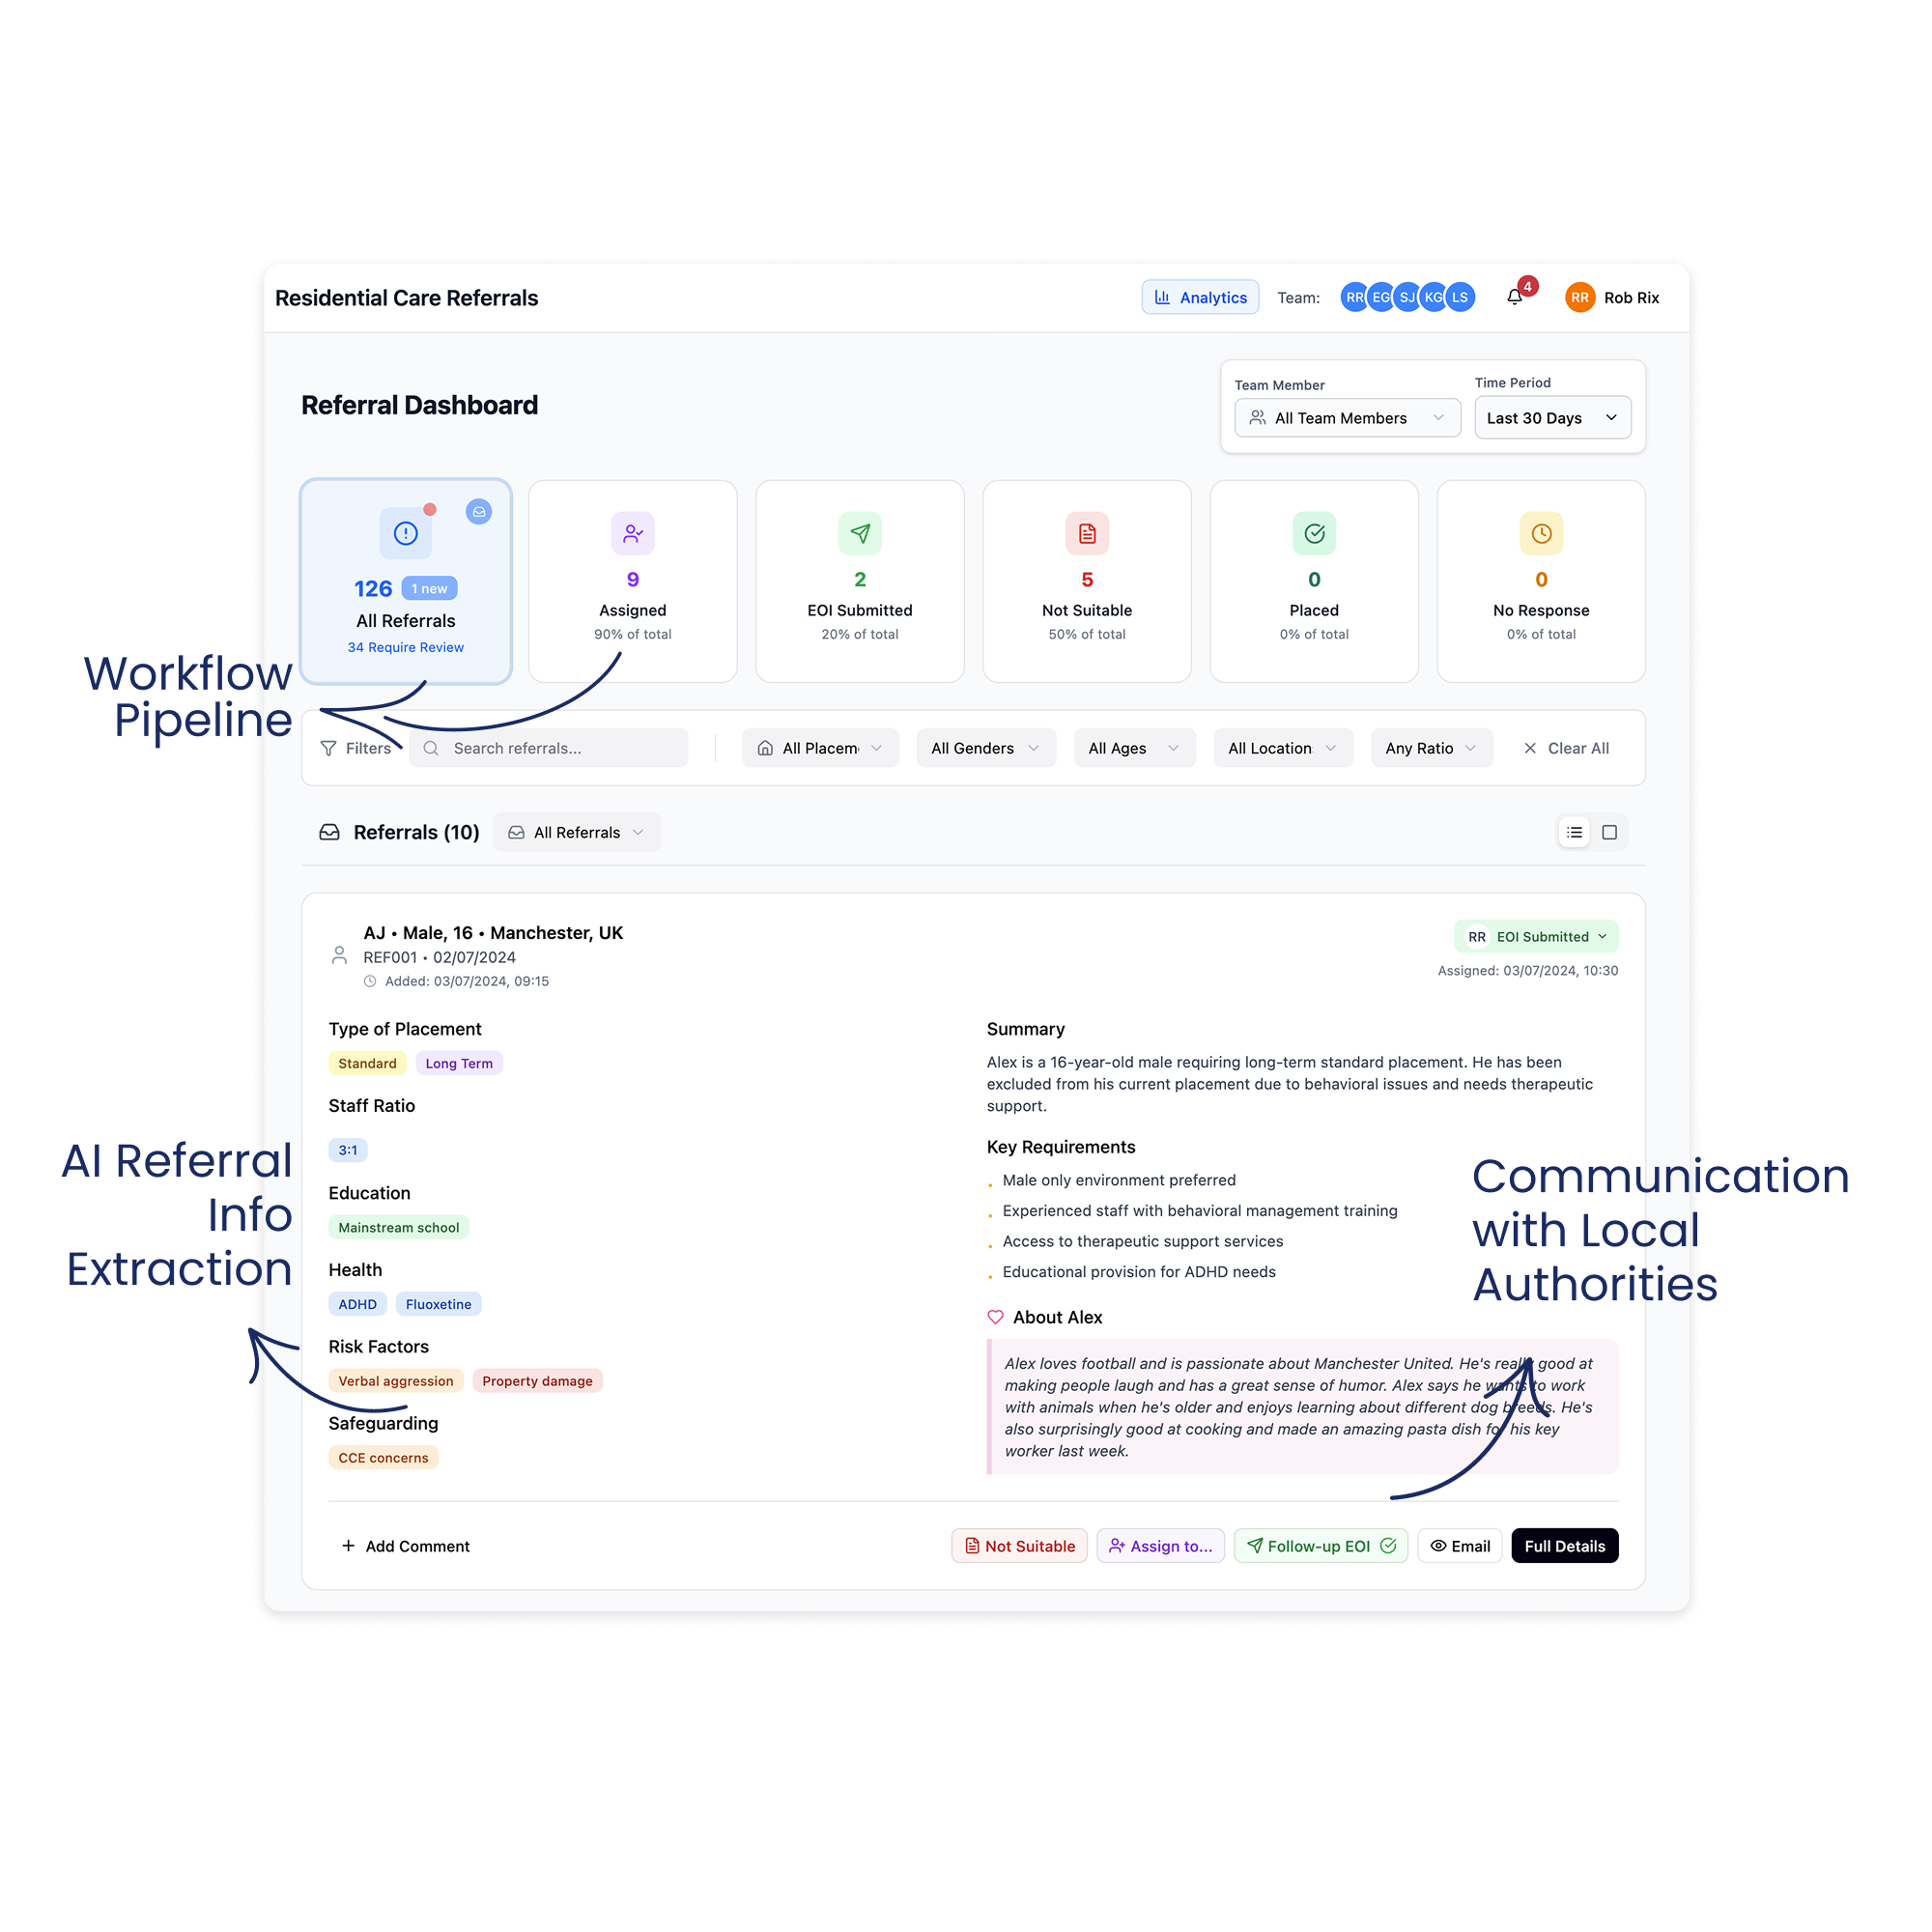
![Image of the Dashboard of Referral System]()
Referral Dashboard
-
![Image of a card showing extracted child information from a referral.]()
Using AI to Extract Key Child Information
-
![Image of the product showing how to directly respond to the local authority]()
Responding to the Local Authority Directly
-
![Image of a card showing tools for team collaboration like assignment and commenting]()
Tools to Support Workflow & Team Collaboration


Testing V1 & What We Learnt
We launched V1 with two care companies as primary pilots and ran demos with 8+ organisations alongside.
The goal: could Bridge replace enough of the email workflow so that users will open it daily?
What Broke
The inbox wasn't complete. Bridge captured referral emails but not threads, follow-ups, or internal discussions. Users still had to run two systems in parallel, and this added burden to their workflow.
The AI created “fake” referrals. Thread replies picked up as new cases, cluttering the system. We started to identify a great deal of referrals that were not following the “happy path”
No way to fix mistakes. No override, no way to correct the “fake” referrals. Errors just sat there. This was making extracting the data unreliable.
Users were not responding to referrals directly from Bridge. The lack of sent email confirmation made users still prefer to use Outlook to respond to local authorities instead of Bridge.
Also, organisation size shaped engagement: While smaller organisations were more forgiving with our system still facing some issues, they were happier to adopt compared to larger organisations. Large organisations needed completeness - they did not accept a system that wasn’t able to capture until the last referral.
Growing Anxiety
The technical work on edge cases (Secure referrals, password protected, sibling referrals, forwarded emails, missing informaiton, etc) proved harder and slower than hoped. We started asking if we were solving the right problem the right way.
In parallel, we explored lighter alternatives: an Outlook add-in for AI summaries, extracting Egress and Portal referrals into email to simplify access across different systems - not formal proposals but explorations alongside the main work.
What We Learnt
During this time, we continued doing demos, which added excitement but also pressure to our team. Organisations loved what they saw but came with expectations we could not yet meet: multi service support, CRM integrations, bespoke reporting. This was validating our solution but also stretching our focus.
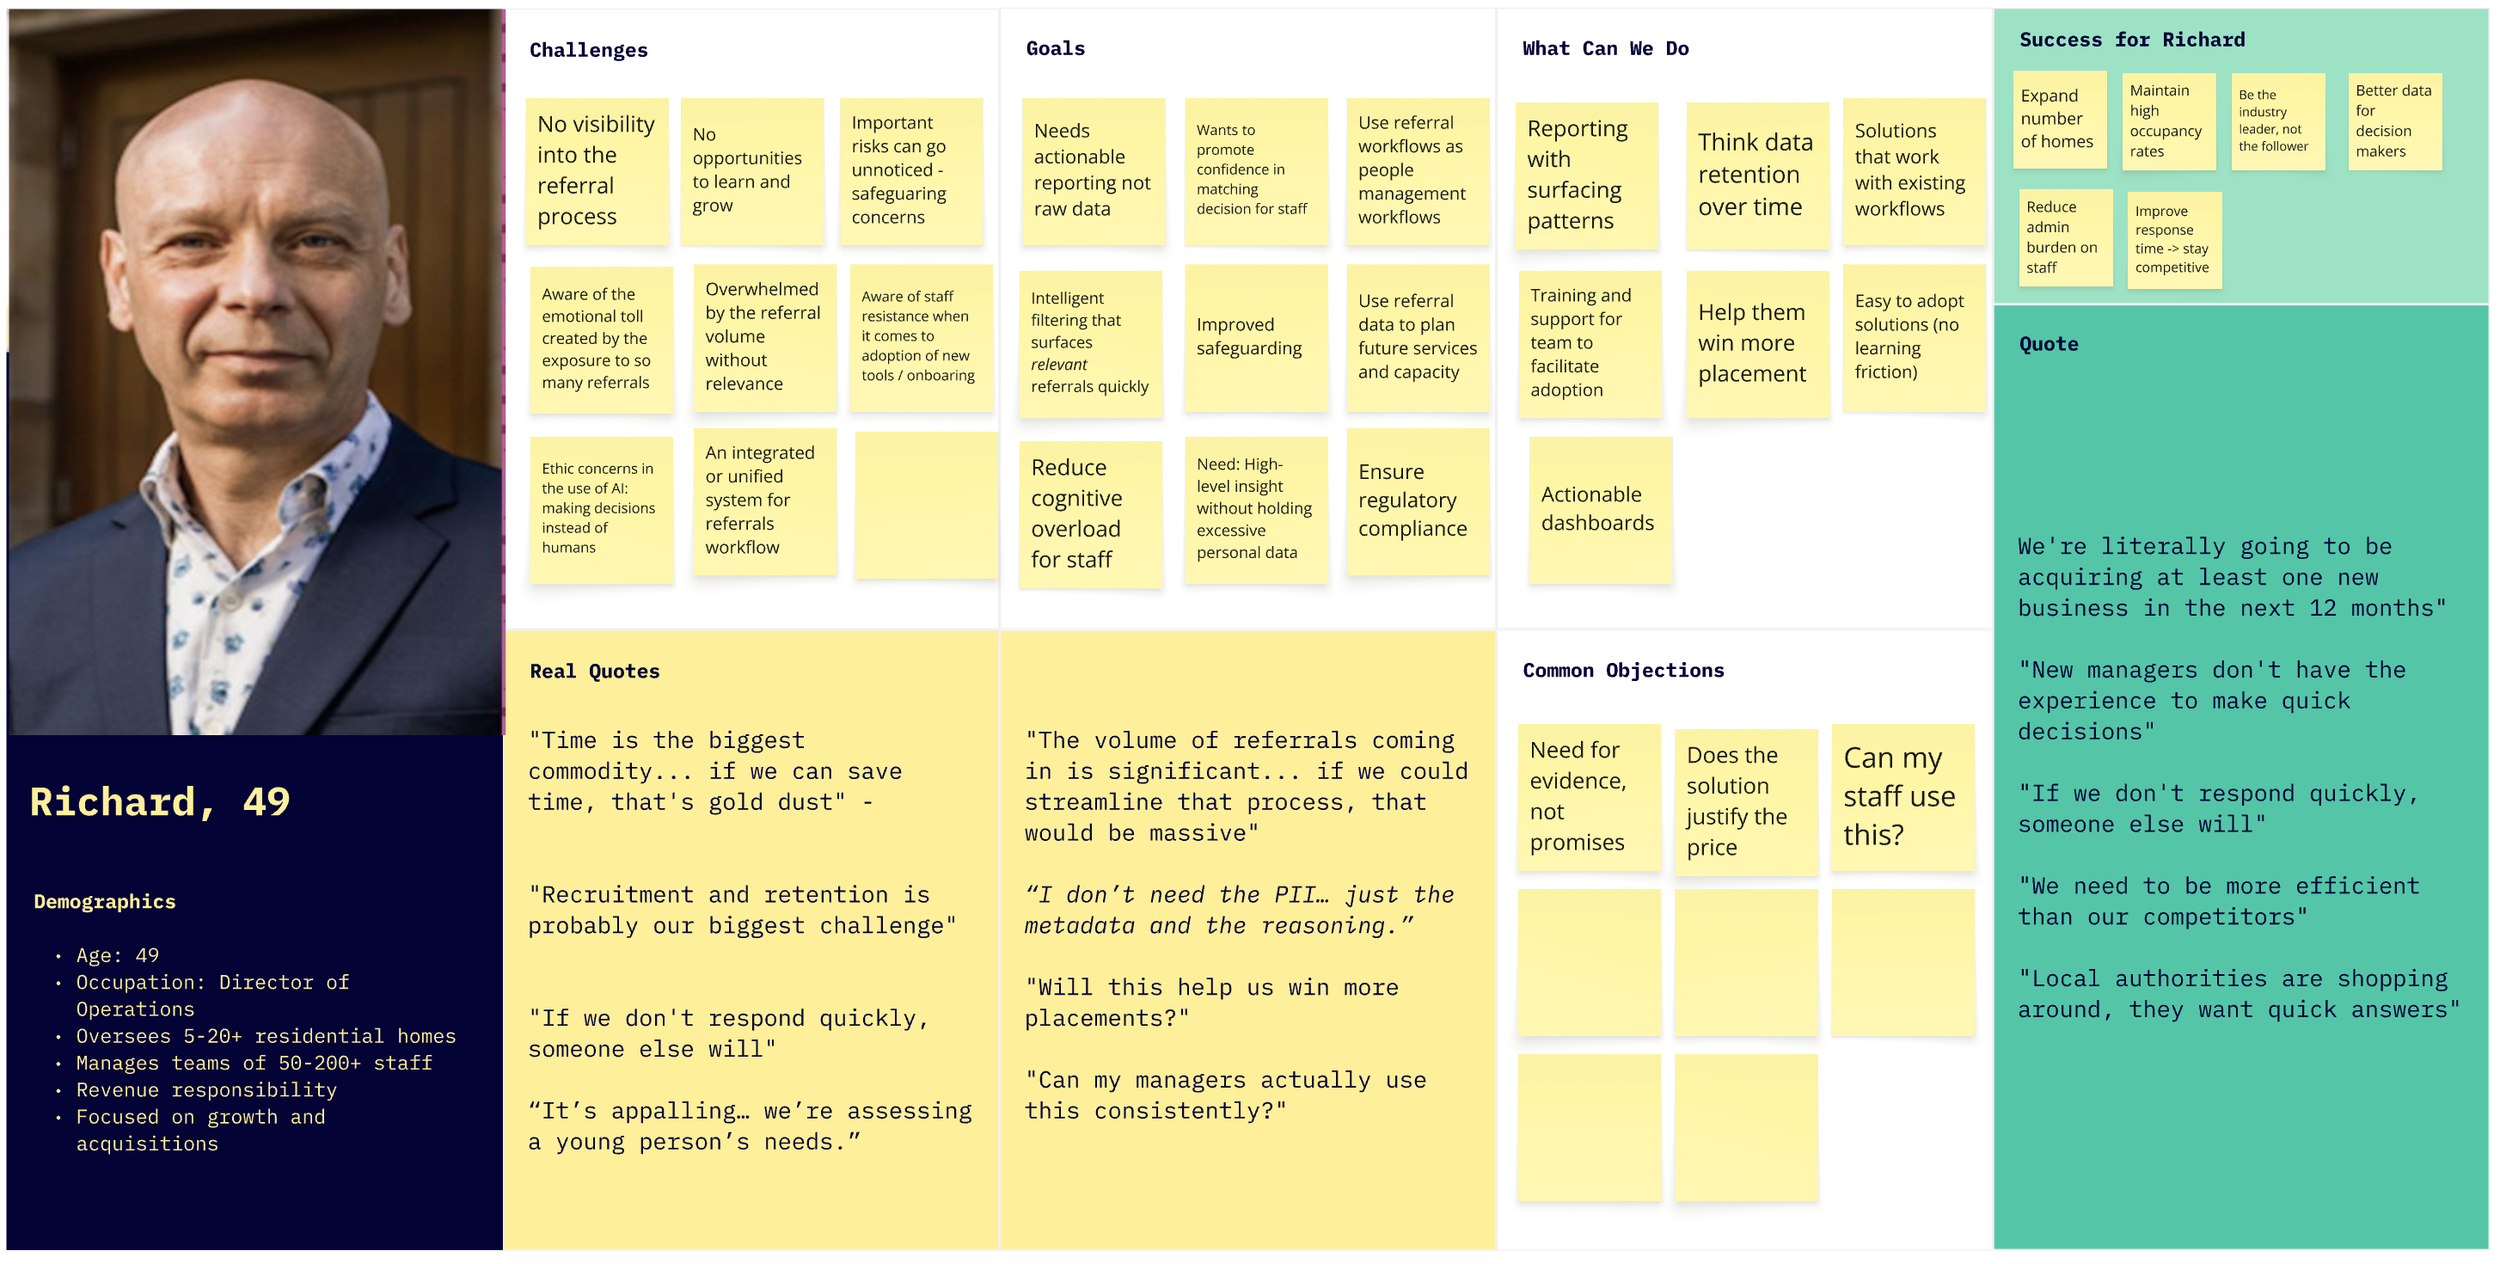
At the same time, a new persona started to emerge: the Director as the buyer of the solution. Directors cared about different things: volume data, rejection patterns, response time, audit trail, and intelligence for growth decisions.
We have validated the solution, but it required a great deal of work to be adopted and used daily. We converged our learnings together: tech complexity, pilot struggles, lighter-weight explorations, demo feedback, and moved ahead to build V2. The next main objective was to bring the human-in-the-loop, giving users the ability to correct the system and adapt it to their needs.
V2: The Email-Native Pivot
We built V2 on one principle: reduce complexity, build trust, give users manual control and integrate with Outlook rather than replace it altogether.
1. Full inbox visibility and new layout
Why: The referral officer couldn't trust a system showing only some emails. V2 also needed to display threads, non-referral emails, and correction flows, so the card-based dashboard no longer worked. Users spend their day in Outlook, so we leaned into what was familiar.
What we built: All emails visible, with non-referrals being tagged as “non-referrals”. A three-panel layout: navigation left, email list centre, detail right.
Outcome: Small learning curve and easier adoption.
2. Manual correction
Why: AI errors in V1 were permanent. Every uncorrectable mistake eroded trust.
What we built: Mark non-referrals as referrals and vice versa. Manual upload for missed referrals. "The system suggests, I confirm."
Outcome: Errors became fixable moments. In a domain with personal liability, a system that can't be corrected can't be trusted. We should have built this from the start.
3. Analytics
Why: Directors wanted data, but building a full reporting suite before understanding what mattered felt premature.
What we built: Deliberately basic reporting. Volume, rejection reasons, source distribution - rough enough to invite critique.
Outcome: Directors started describing data they'd never tracked. One outlined success patterns by age range. Another talked about using referral data to decide where to open homes. The rough prototype taught us what questions they were actually asking, surfacing requirements and informing our next steps.
4. Responding in Outlook
Why: In-app email response introduced technical complexity that we could have easily avoided.
What we built: A button that opens the reply window in Outlook. Bridge handles triage, Outlook still handles communication, with an easy transfer from one platform to the other by accessing the email link directly.
Outcome: Provided more functionality and control over how to respond and whom they can include in the local authority communications.
5. Flexible status model
Why: As demos increased and we discovered new types of workflows, we needed to accommodate different stages, terminology, and structures. We weren’t ready to implement editable options, so we increased status variety to include all needs.
What we built: A status system that accommodates variation and gives teams enough options to collaborate.
Outcome: New organisations could use Bridge with minimal workflow changes.
Impact, What Comes Next & Reflection
Initial reactions were honest. Users missed V1’s visual clarity. But as they explored, they noticed what they could now do: full visibility, correction, and improved status visibility. V1 was simpler, but V2 was more capable.
“I would probably have to say I prefer the initial version because I know it. I can definitely see it’s got increased functionality, but it’s just the case of I need to use it” - Referral Officer
Positive Impact
Significant improvement in referral processing time: from 5-20 min to a few seconds - initial suitability assessment through AI summaries.
Big steps towards the so-called “Unified System”. We managed to extract and centralise referrals from three different sources, moving towards the much-needed “Unified System”: Email, Egress Extraction, and Placement Portal in one system.
Team collaboration and visibility increased, and is now done via one single channel and is easily trackable rather than scattered across emails
Growing customer base from 0 to 4 active partners and 5 in the pipeline. From zero to a growing network across the UK and Scotland.
One product meeting the needs of all stakeholders. Directors need compliance visibility. Officers need speed. Managers need easy access and collaboration. Interface, analytics, and auditing in one single system.
What comes next
Removing the Outlook add-in. We decided that the solution is quite basic compared to the needs - it only solves for a small fraction of the issue, and we left it out for now.
Pipeline management is the next value layer. Organisations want to track referrals beyond triage, through matching assessment and placement decisions. The system is evolving from a referral inbox toward a placement CRM.
A knowledge base became necessary. As we onboard more organisations, the product needs to be self-explanatory for managers rotating into duties, new staff, and directors checking analytics.
Role-based permissions. Full inbox visibility for all team members proved unacceptable in larger organisations. Different levels of access became necessary.
Continue the extraction for other Edge Cases. Extracting referrals from Placement Portal and Egress gave us confidence with other encryption models to save users time and effort, having to navigate between systems.
Engaging in more careful research to support the matching decisions. Matching a child to a home is one of the most skilled and consequential things a manager does. Almost every manager described it as deeply subjective with no shared framework. They weigh risk factors, group dynamics, staff capability, location, trauma history, and instinct, all at once. The goal isn't to replace judgment. It's to support the reasoning behind it: surfacing the right information, prompting questions worth asking, and helping build an evidence trail. Getting this right will take careful research and close collaboration with the people who do this work every day.
Reflection
This was my first time leading product end-to-end. With no established process to follow, I have built the research programme, the design direction and the alignment infrastructure from scratch, while learning a domain where the consequences of bad decisions are measured in children’s lives.
Some things I would do differently with what I know now:
Explore more possibilities before committing to one. I’d prototype three approaches in parallel before investing in a full platform, trying to solve even smaller problems with each solution. On the same note, think about how to bring the design where users are, rather than building a new destination product.
Build systematic testing for AI edge cases early. Research uncovered many edge cases, but some critical ones only surfaced through real use. Users reporting errors became our most valuable feedback loop, and eventually, we built a database comparing email intake against Bridge output to verify processing accuracy. This led to close collaboration with the engineers on prompt refinements and conditional logic that improved reliability. Starting with the verification infrastructure earlier would have caught issues before users did, and I’d prioritise it from the start in any AI- powered product.
Adapt the design workflow to match the team's pace. As the team adopted faster coding tools, I found ways to keep up: moving from Figma canvas to Figma Make and rapid prototyping tools, focusing on annotated artboards that communicated intent rather than pixel-perfect specs. Engineers were pulling directly from prototype code to deliver, which meant design and development were closer together than in a traditional handoff. The next step I'd take earlier is getting access to a local branch to make UI updates directly, with engineers reviewing and merging. That would narrow the gap between design and delivery.
These are the principles I have developed through this work and for sure they will shape projects in the future. I guess the biggest shift in my thinking was realising that I wasn’t just designing a product but a touchpoint in a span of organisations, channels and regulations.
The measure that matters
Every referral represents a real child who needs a home. The managers carry personal liability, and the referral officers spend full days so no suitable placement gets missed. This product exists to give those people back the time to make better decisions for children.
"Year on year, as we're refining it, as we're using the data better to inform our decisions, that's what we should see: better longer-term placements for young people." - Director, Multi-Home Group